For the past few years, Albert Koehl and I had been tracking Toronto’s bike lane installations to hold the City accountable to their 2016 Cycling Network Plan. While I didn’t prepare such a report for 2021 – instead focusing on the 2022-24 Near Term Plan – the City of Toronto recently released their 2021 Cycling Year in Review. This is a welcome development which will help improve accountability on the cycling file. I reviewed the report to see what it has in store and how it can be improved.
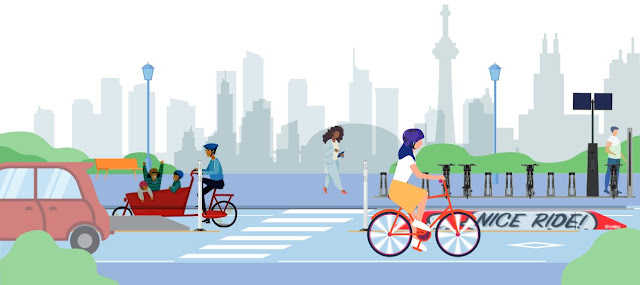 |
| Toronto's 2021 Cycling Year in Review cover illustration shows a cargo bike |
One thing I appreciated is the use of a cargo bike in the cover illustration. This gesture shows how cargo bikes are increasingly becoming mainstream in Toronto (and elsewhere in North America). I hope the City can keep showing cargo bikes in their cycling materials.
The main bike lane table not only shows 2021 installations, but also those from 2016 to 2020. While it’s good the City stopped using lane kilometres, I would suggest removing sharrows from this table as they are not infrastructure. The six year total is 87 kilometres with 2020 and 2021 experiencing the most installations, but the City is 114 kilometres behind their 2016 bike plan target. Cycle tracks make up almost half of the installations during that time (49%) with cycle tracks on arterials expected to represent a greater proportion in the future.
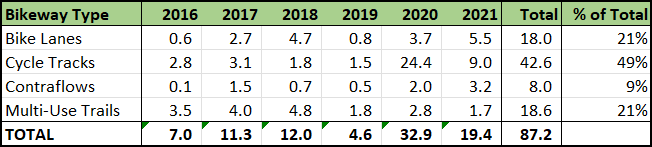 |
| Revised bike lane table without sharrows |
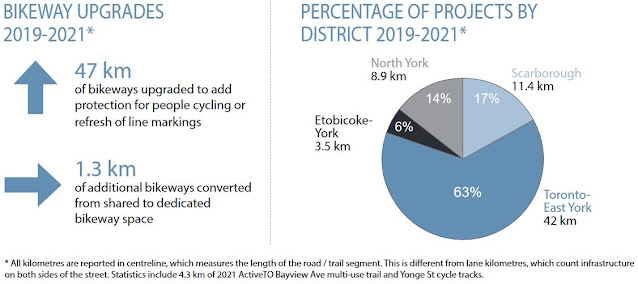
The year in review showed how many kilometres of bike lanes were upgraded for 2019 to 2021, as well as the below breakdown by district. This district breakdown gives a powerful indicator of the need for the City to focus more in the inner suburbs; especially in Etobicoke-York.
Page 3 of the report offers several useful metrics related to bike share, bike parking, bikeway coverage, and collisions. However, I don't understand why the 2021 collision data would not be available at the time of publication. Hope the release of annual collision data can be fixed in the future. Page 4 shows a summary of key bikeways completed (e.g. Yonge, Esplanade-Mill, and Winona) while the full list of 2021 bikeway installations can be found on Page 5.
If there is one omission which needs to be called out, it’s the lack of disclosure on the Cycling Unit budget spending; especially considering past challenges of fully spending their budget. I would suggest disclosing the amount budgeted (which will be $20 million annually starting in 2022), the amount spent, and several lines on how the money was spent. The budget issue was highlighted by the Toronto Community Bikeways Coalition in this NOW Toronto article from January 2021.
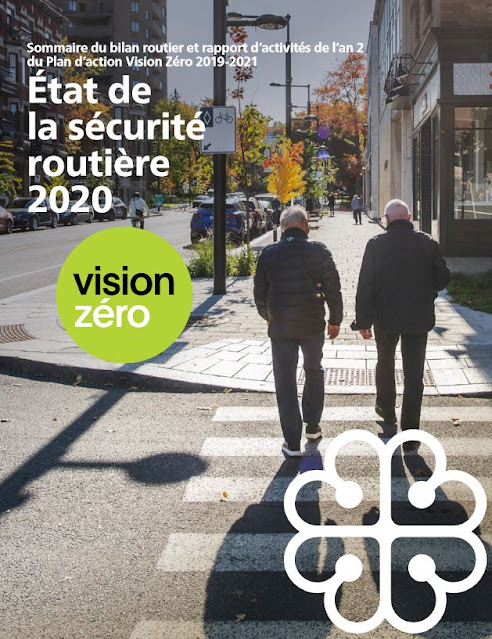
For some future inspiration, Toronto could look to Montréal’s Vision Zero report from 2020. They show KSI (killed or seriously injured) numbers dating back to 2005, as well as comparisons of deaths per 100,000 people to over 20 other municipalities and details of different collision types. Montréal’s report is very detailed explaining what was accomplished in recent years, including a children’s cyclist education park in Plateau-Mont-Royal. Speaking of which, Toronto may need a separate annual report for Vision Zero.
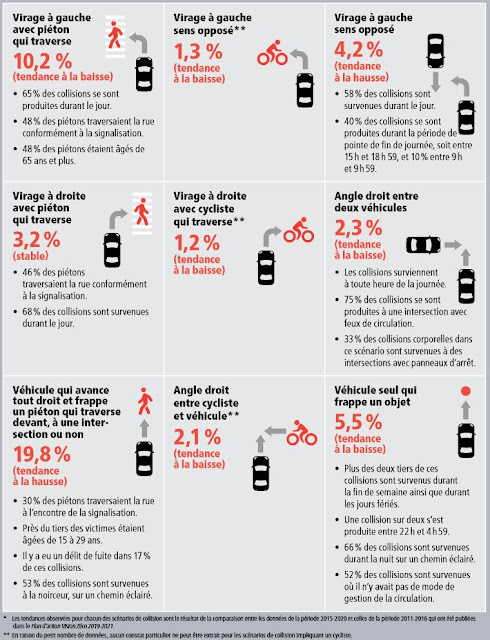 |
| Toronto should disclose collision type statistics as Montréal did with their Vision Zero report |
For their first attempt at a cycling annual report, the City of Toronto is off to a good start. Improvements such as disclosing budget spending, removing sharrows from the bike lane table, and comparing with other municipalities would help create increased transparency and encourage Toronto to push harder to make its city more bike friendly.
No comments:
Post a Comment